How we report results: the live dashboard and the monthly report
The DaveLabs Team2 min read
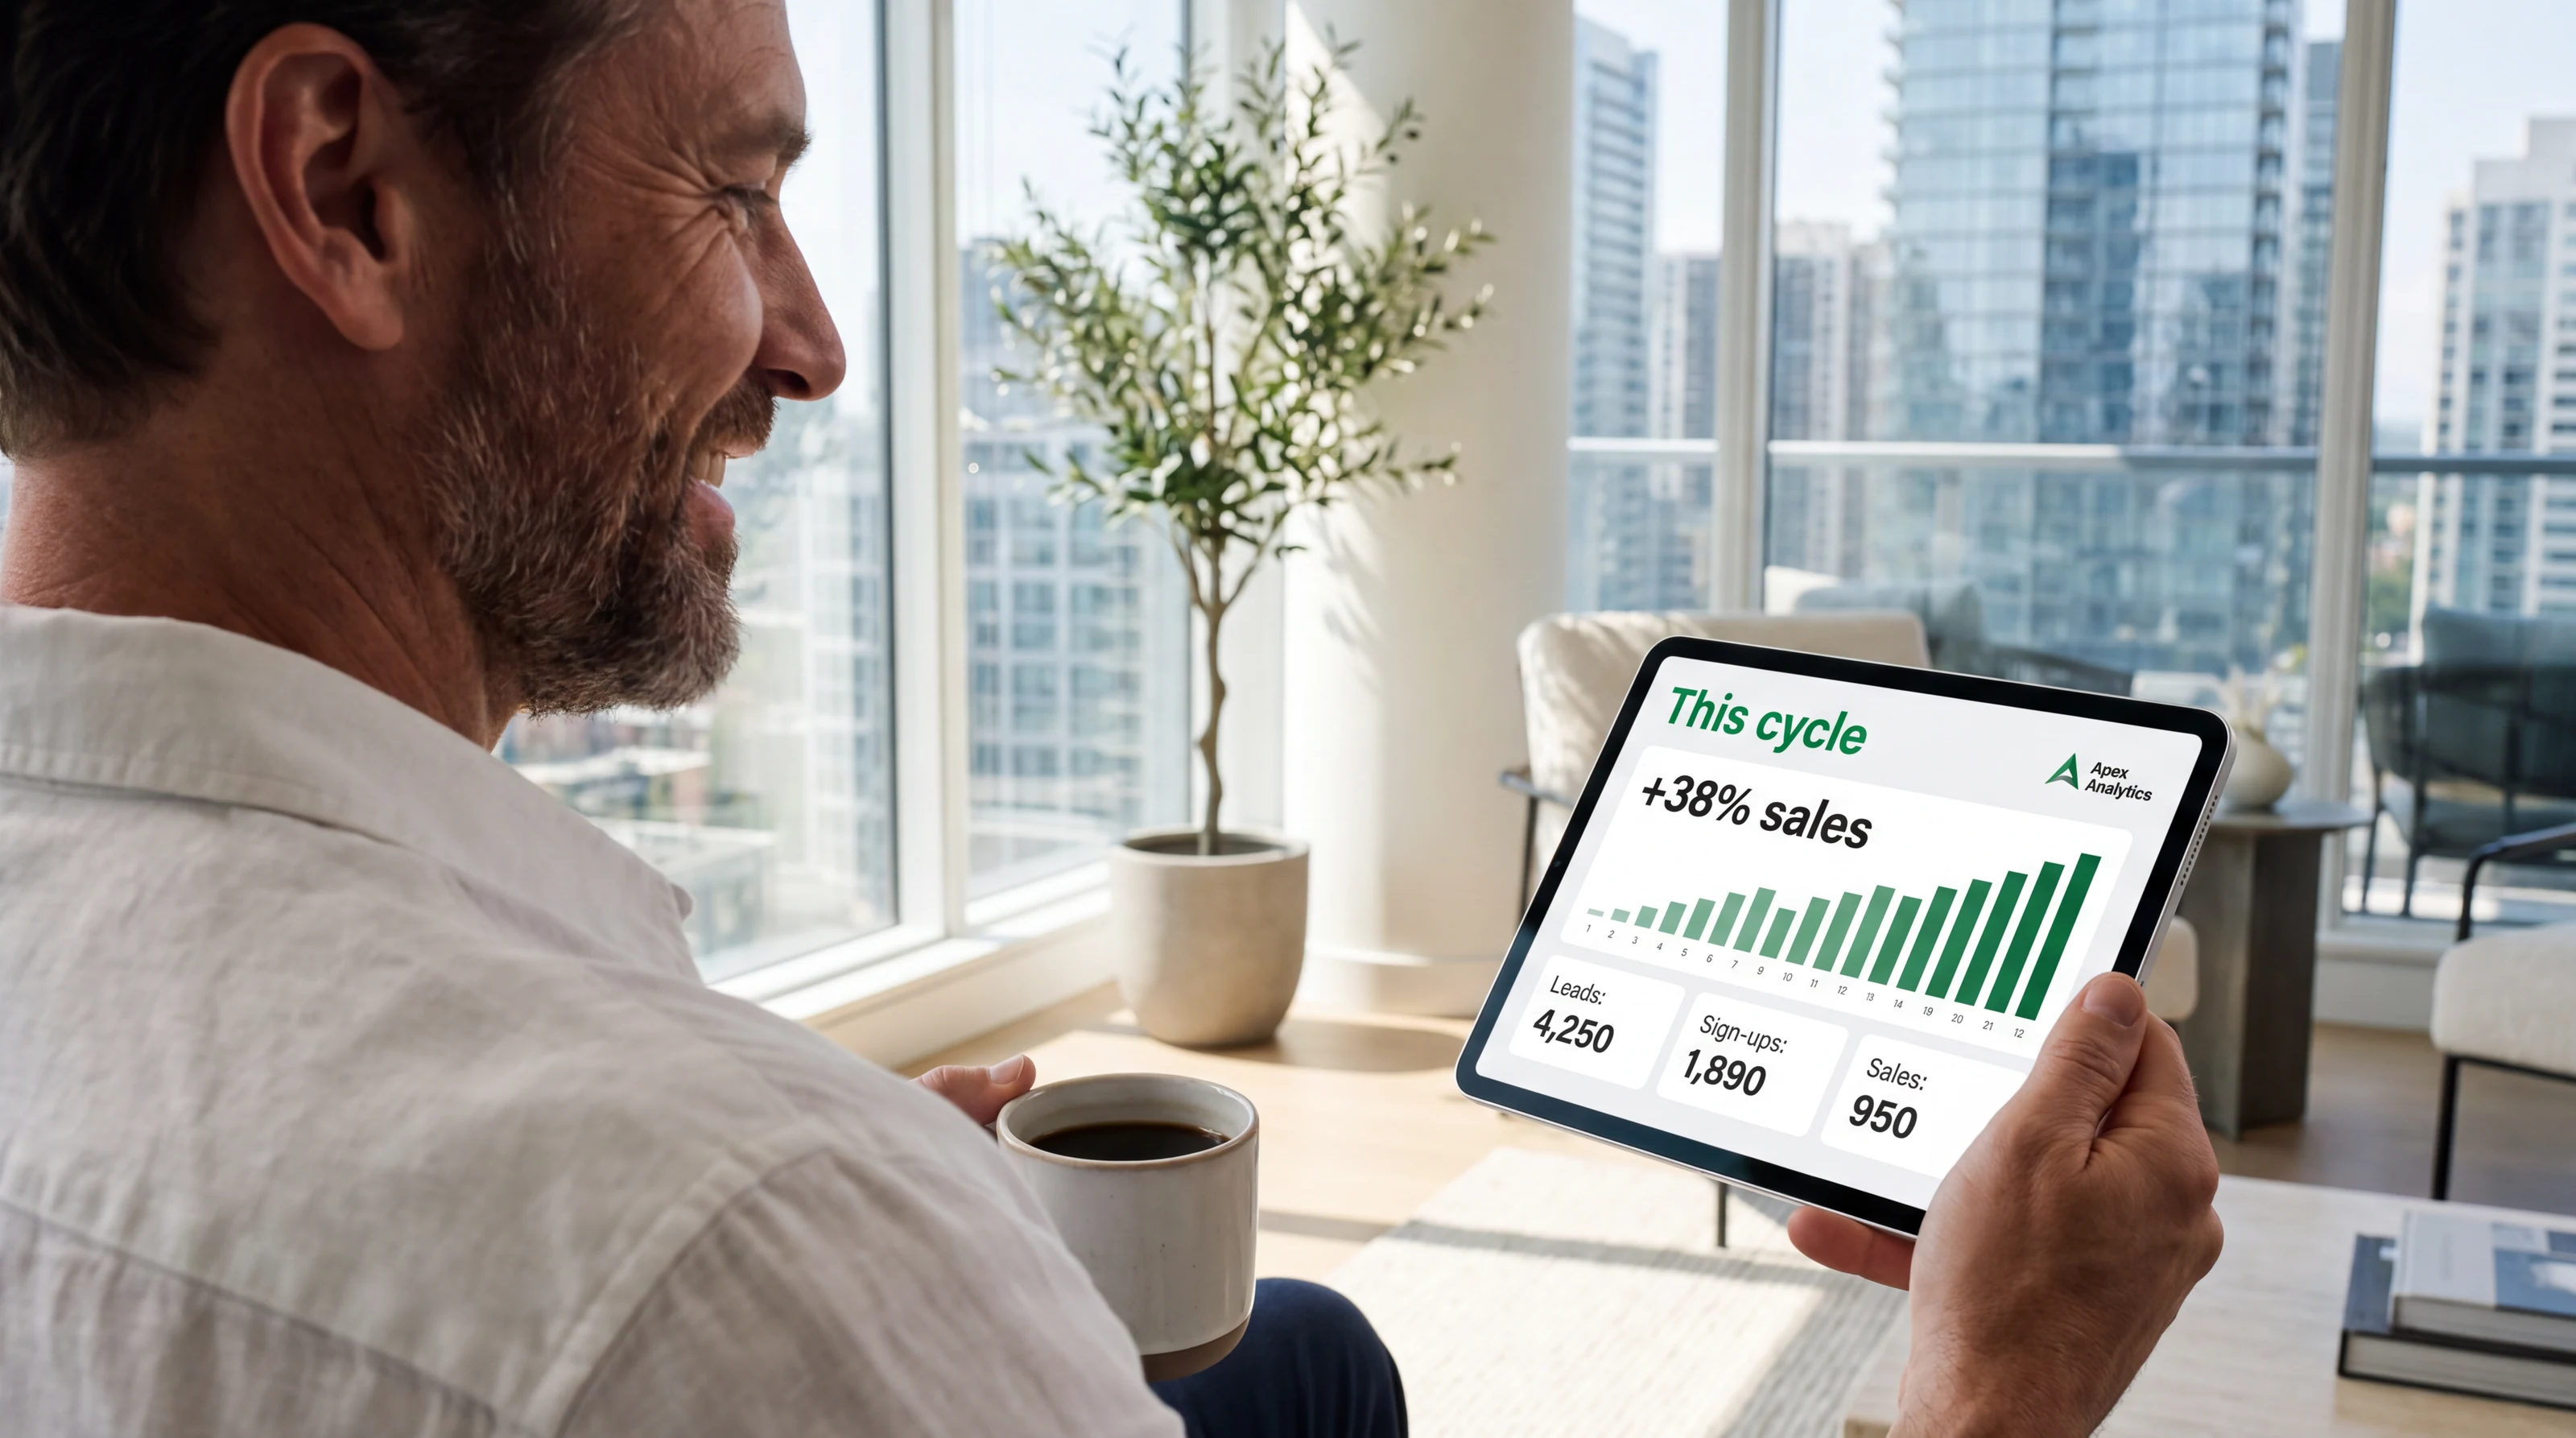
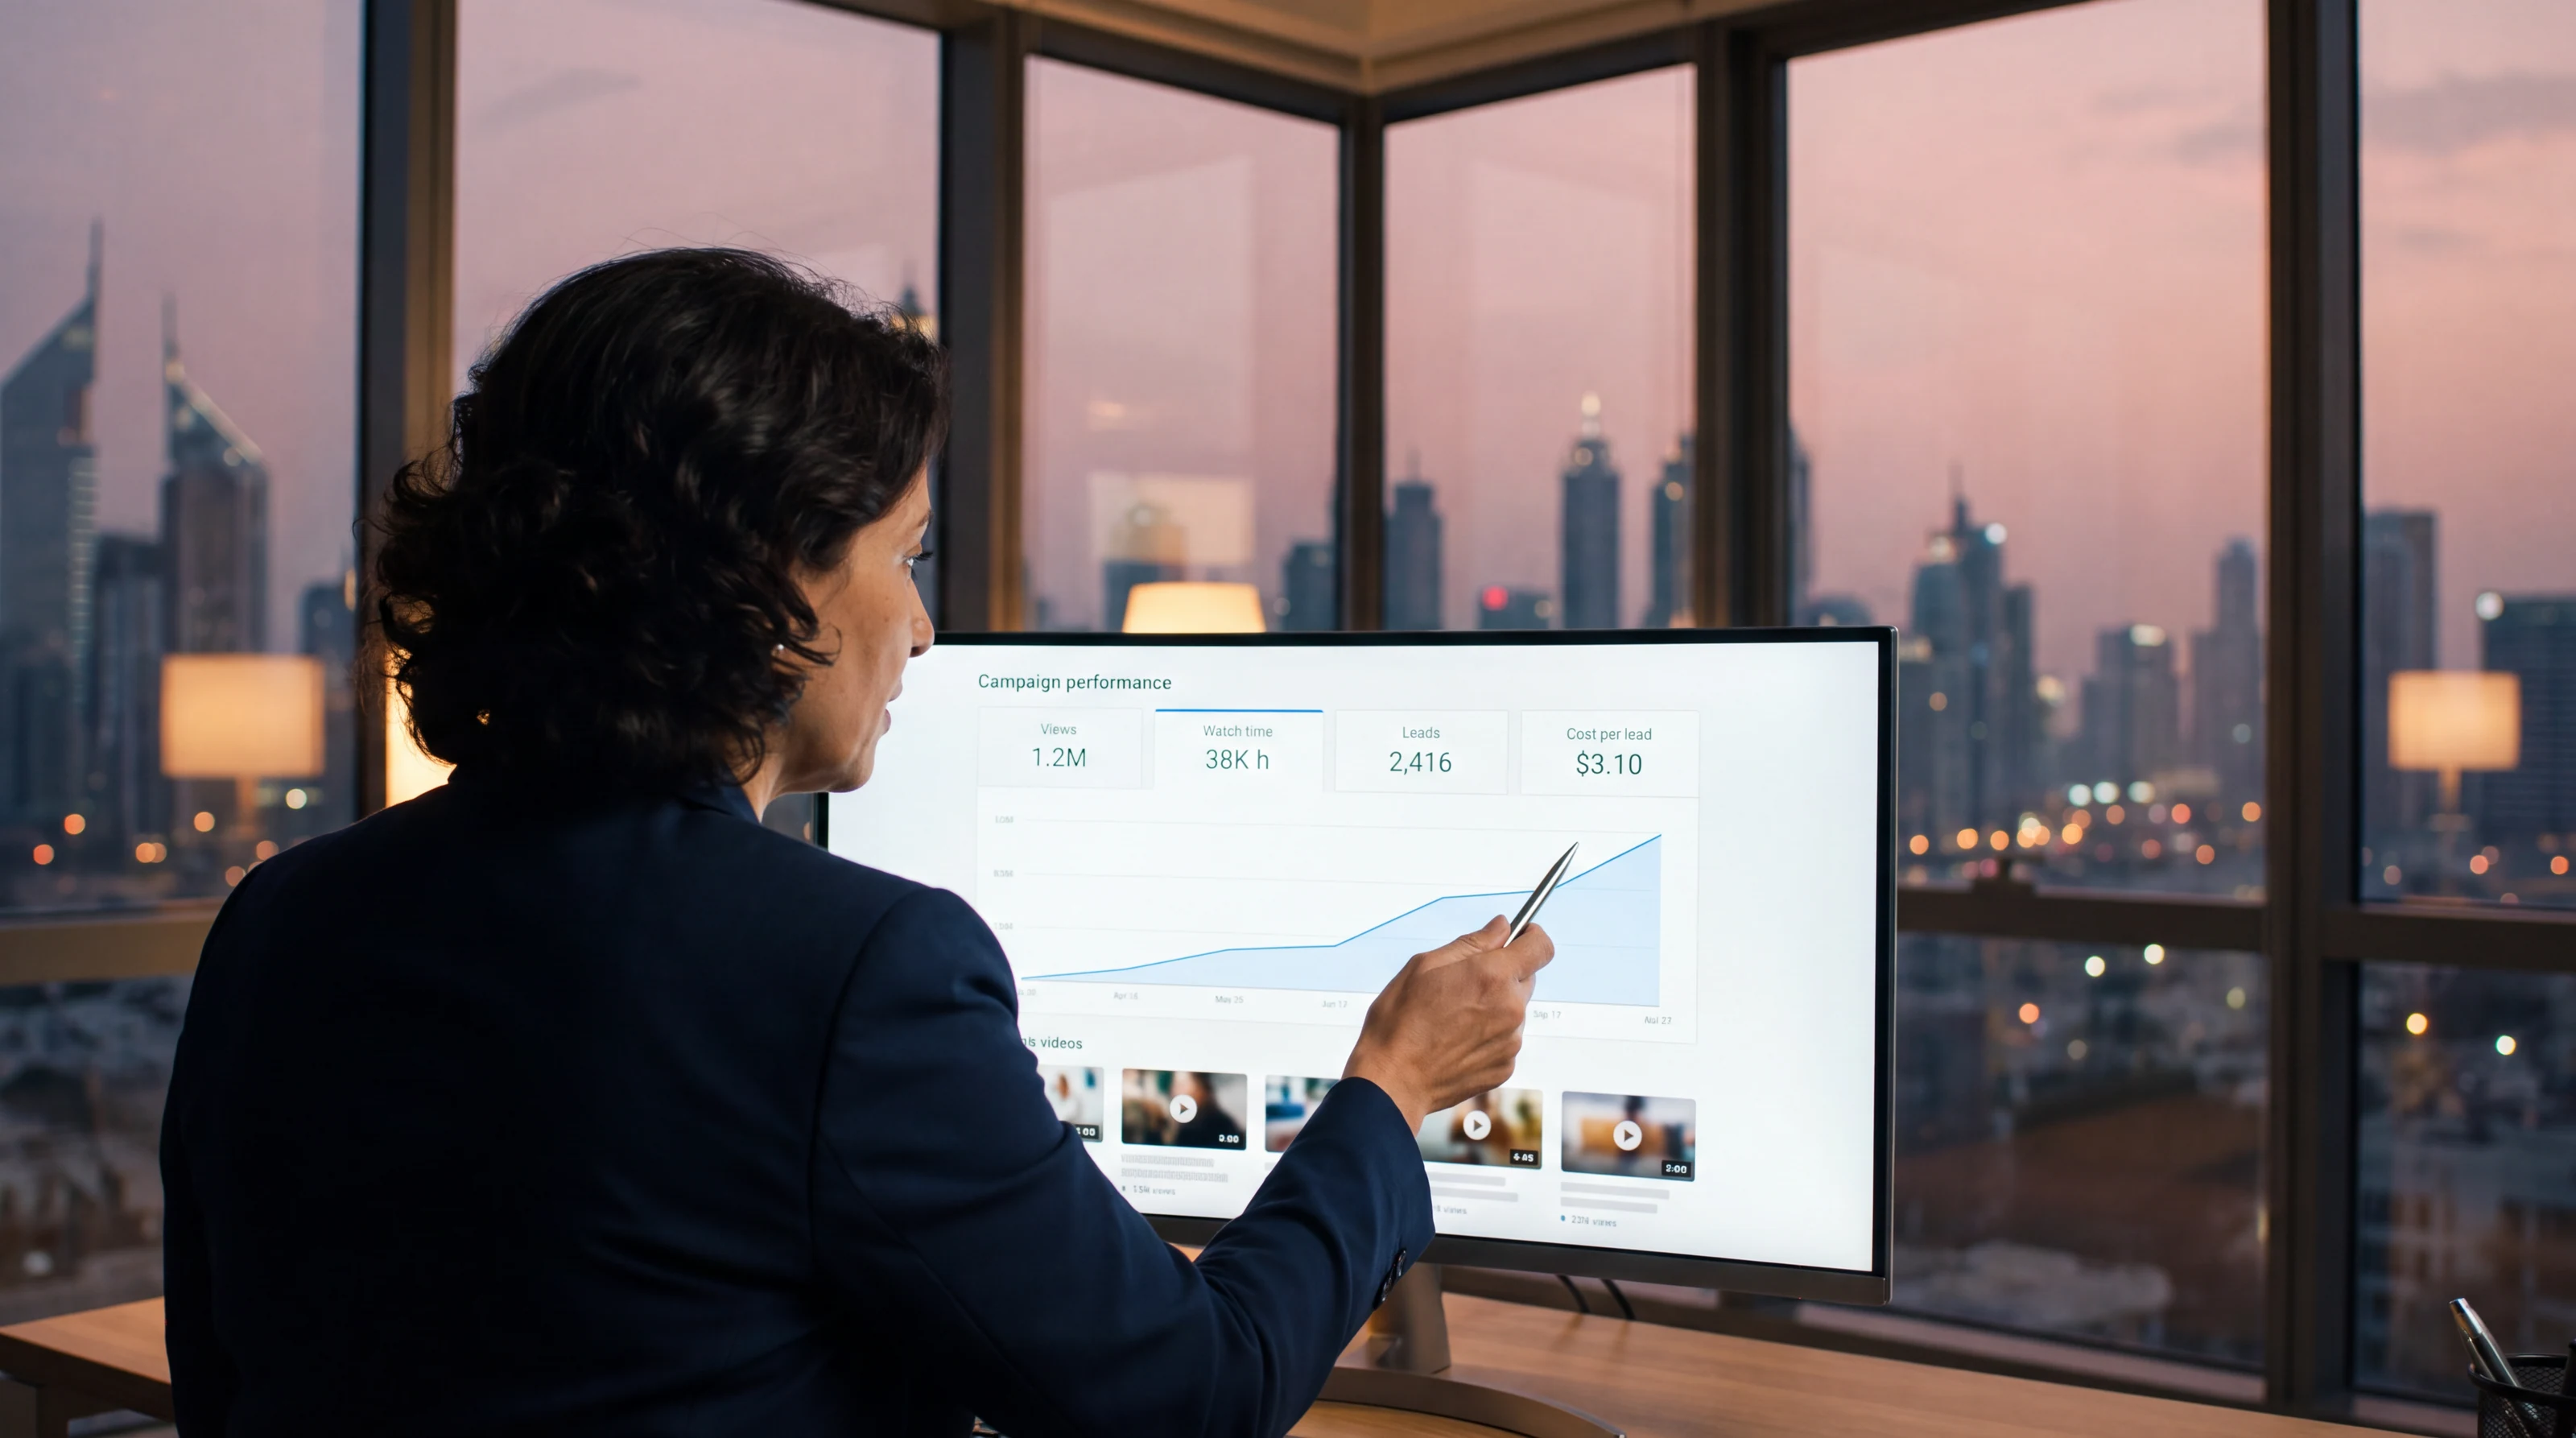
You should never have to ask how your marketing is doing. With Optiq Studio Enterprise you see it live, you get it in writing every month, and you get the full story at the end of every cycle.
Two dashboards
- Yours. Your company's own view, for you and your team, each person with their own sign-in and a role: owner, admin, billing or viewer. The funnel, your customers, every result, your videos, posts and ads, live.
- Ours. The dashboard our team works in, where each person sees only the companies they are assigned to, and every action is recorded.
What you see live
- The result against the goal for this cycle.
- The funnel, step by step, and where people stop.
- Every video, where it was posted, and what it earned.
- Every ad: budget, spend, and what it bought.
- Who is watching: age, gender and country.
- Where the cycle is: what is made, posted, promoted and due.
The monthly report
One calendar month of your company, downloadable: what went out, what it earned on each platform, who watched, what paid reach did, and what was paid. Views come from each platform's daily figures where it gives them, as YouTube does, and otherwise from how far the live counters moved during the month, as on Facebook, Instagram and TikTok.
The end-of-cycle report
The result against the goal, the videos and ads that produced it, what the index taught us about what works for your customers, and the plan for the next cycle. It is the basis on which you decide whether to renew.
How we keep numbers honest
- Every number shows where it came from: a platform, your website, or your app.
- Platform numbers are shown as the platform reports them, never rounded up or blended.
- Anything shown as an illustration is labelled as an example.
- Results are counted once, with each event's own id, and only within the window each platform uses.