Reading your funnel: where customers stop, and what we change
The DaveLabs Team1 min read

Every customer passes through stages: they watch, click, arrive, sign up, and pay. Every stage loses people. The question is never whether your funnel leaks, but where it leaks most, and what to change.
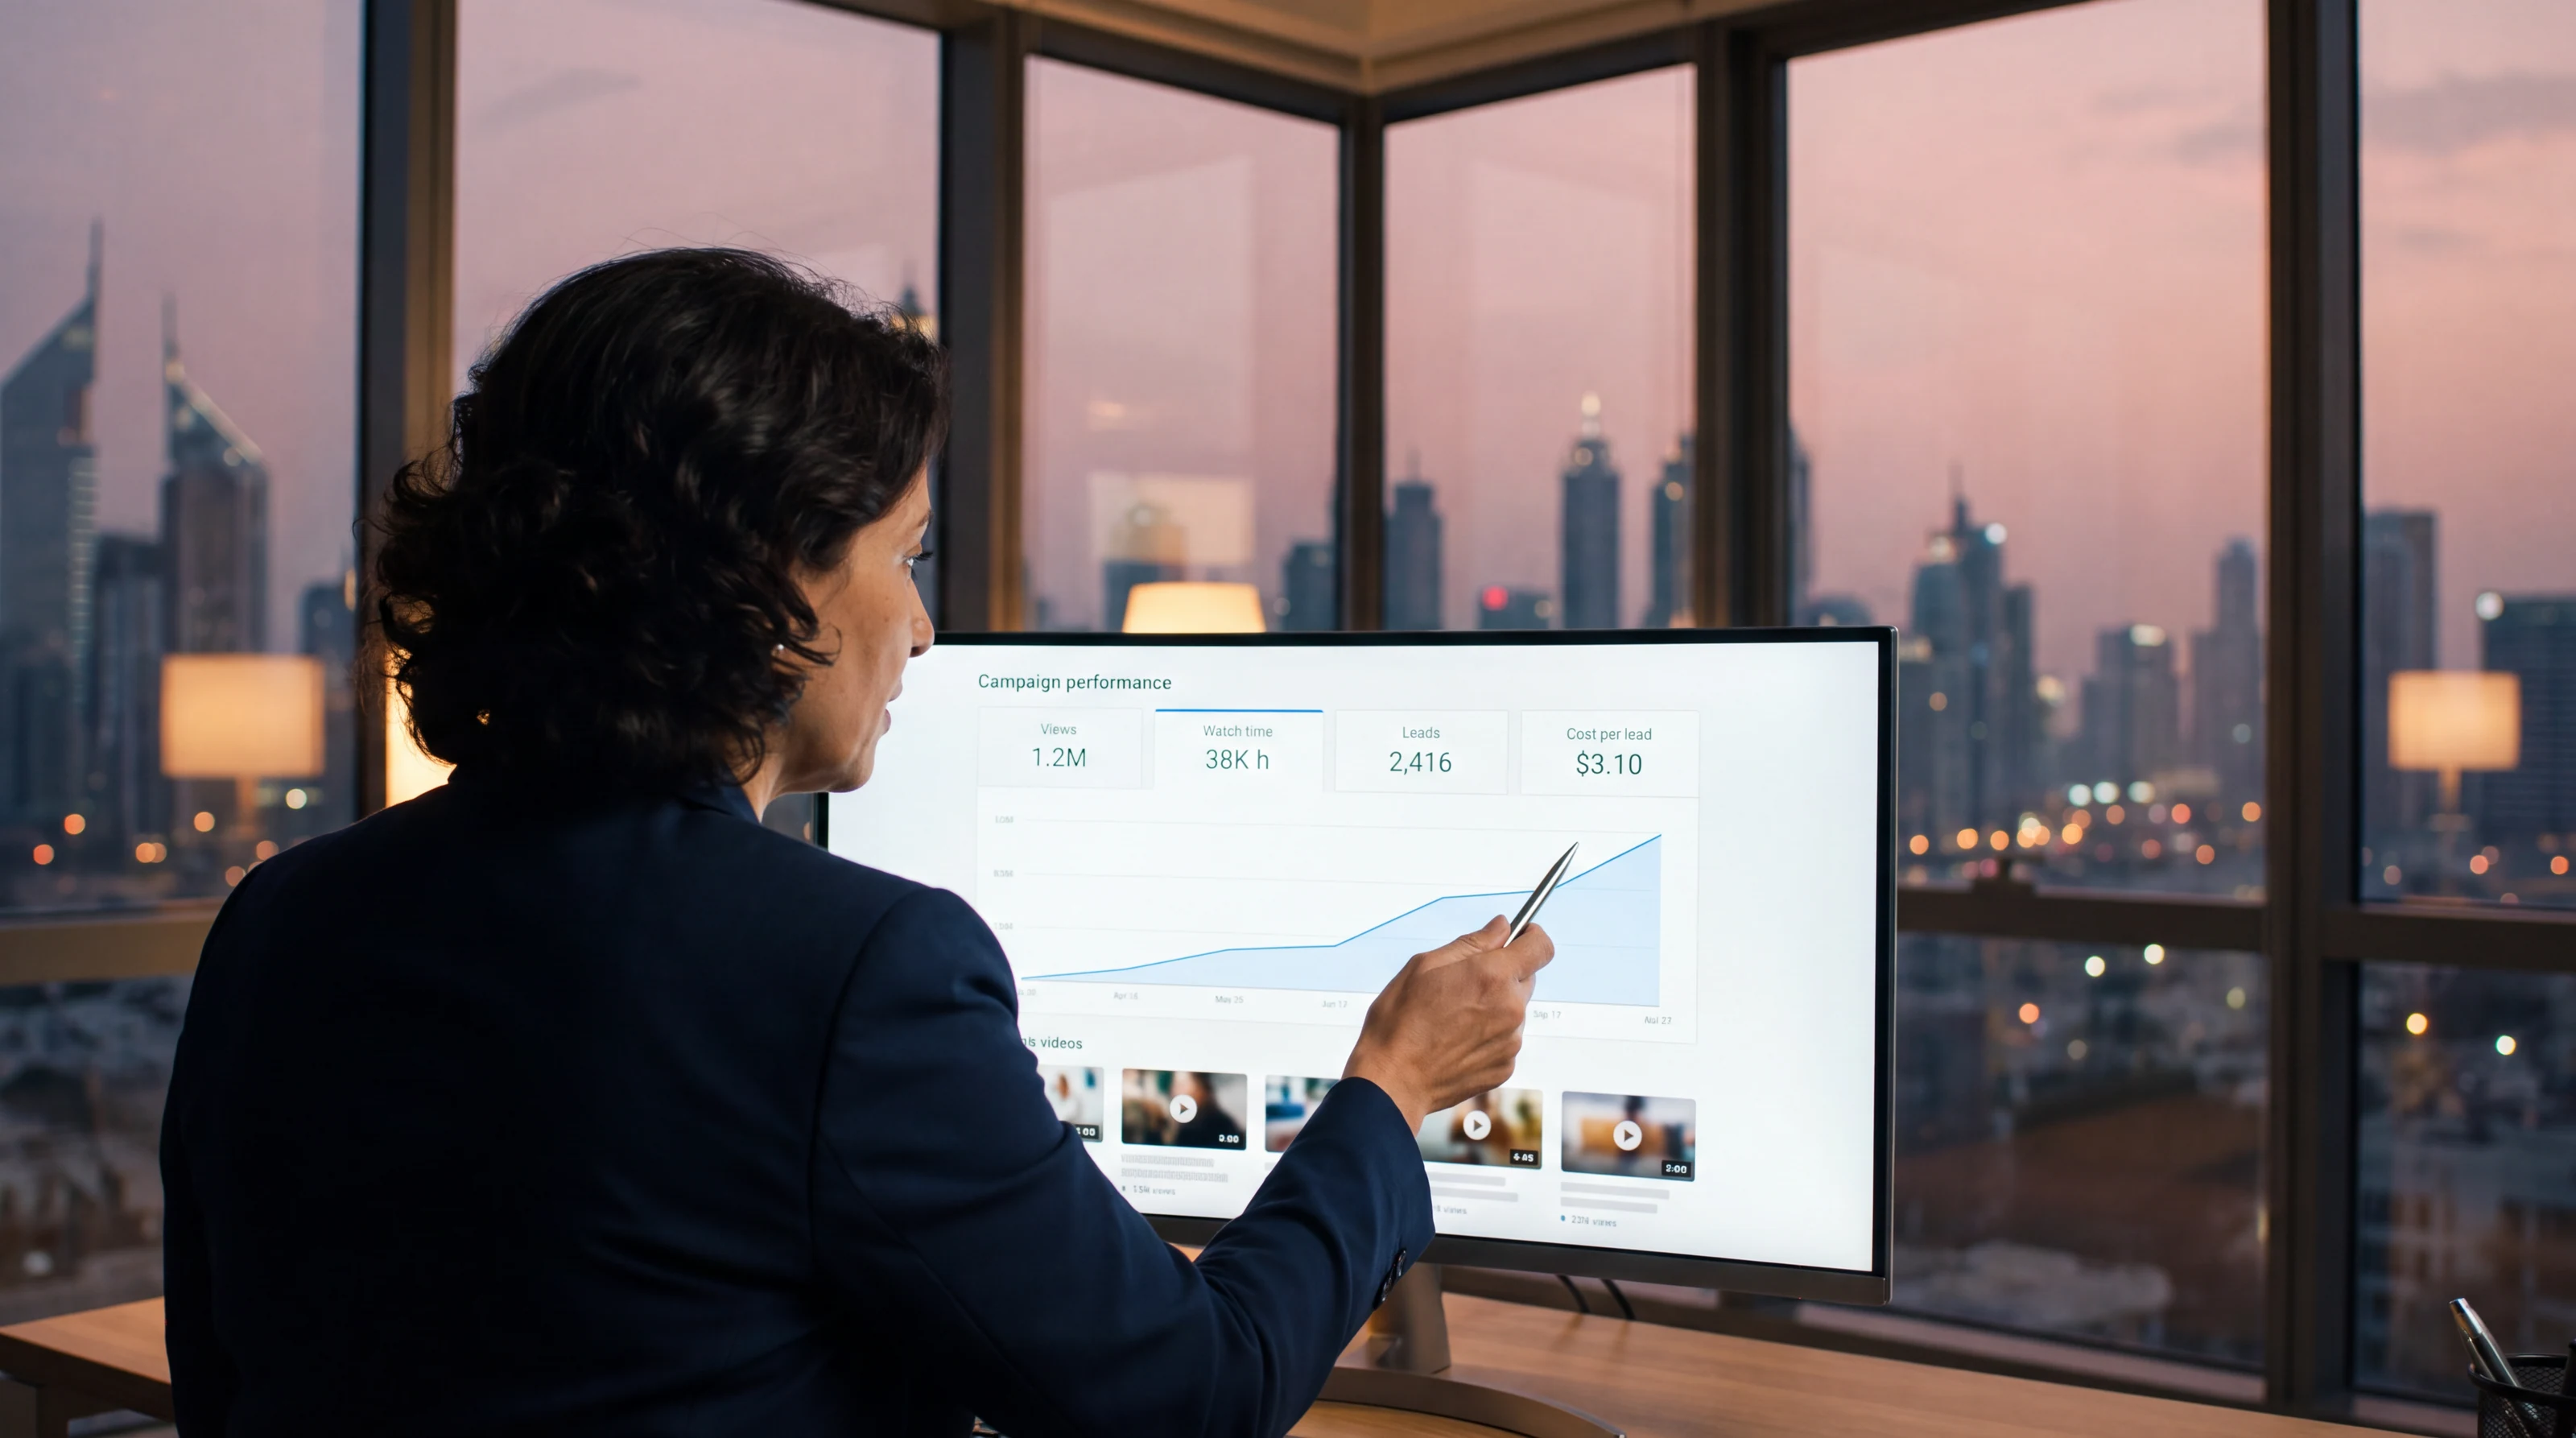
What your dashboard shows
- Each stage, live: how many people reach it this cycle, and what share of the stage before.
- The biggest drop: marked, with what we are testing to close it.
- Your average customer: their age, device, the time they buy, and the video that brought them.
- What is happening now: deposits, forms and sign-ups as they arrive.
An example
Say a fintech's funnel shows that seven in ten people who click reach the landing page, but only three in ten of those sign up. The videos are doing their job; the page is not. We test a shorter sign-up form and a clearer offer on the page, and the next videos promise exactly what the page delivers. The numbers here are an example, not a client's.
A funnel is only readable when it is tracked end to end. That is why we connect your website and apps, not only your social media.